Multi-layer Switch Testing and Analysis
By: Angus Ma (B.Eng., M.Eng., M.B.A.), AHM Technology Corp.
Contents
Test and analysis issues
Sample test scenarios
Test 1: Testing the switching capacity
Test 2: Determining the latency jitter
Test 3: Prioritization based on port
Test 4: Prioritization based on IP address
Test 5: Prioritization based on TCP port
With the increasing deployment of multi-layer switches, the networking industry has focussed extensively on performance testing and analysis issues. Equipment manufacturers are interested in understanding the performance of their devices under load and ways to improve throughput. Service providers, who are deploying high-speed switches in their networks, are interested in testing the devices to verify their ability to provide the required quality-of-service. Finally, enterprise users are interested in benchmarking the switches in order to make informed purchasing decisions. This article examines the test methodology required for multi-layer switches and how to interpret specific test results.

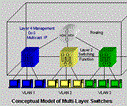
A multi-layer switch can be modeled as a switching system consisting of a number of simpler components. At the data-link layer, it consists of a number of logical Layer 2 switches. Each switch handles traffic from a specific VLAN (Virtual LAN). It also implements its own instance of the spanning tree protocol. At the network layer, it consists of a logical router that provides connectivity between the different VLANs. At the upper layers, the device may also implement advanced switching functions such as Layer 4 management, Quality-of-Service (QoS), and support for IP multicasting.
Test and analysis issues
Each functional component has to be individually tested. One of the main advantages of a multi-layer switch is its ability to forward traffic at very high speeds and with extremely low latency. To fully test the performance of these devices, the test instruments used must be capable of generating traffic at wire-speed simultaneously from a number of ports.
At Layer 2, performance testing seeks to quantify performance issues such as:
- What is the throughput of the devices when all the ports are transmitting at wire-speed?
- How does the behavior of the switch change when the traffic is non-meshed, partially meshed or fully meshed?
- What is the latency of the switch?
- Can the device forward Layer 2 broadcasts at wire-speed?
- How many MAC addresses can be stored in the forwarding database?
- Does the switch provide traffic isolation between two VLANs?
At Layer 3, performance issues include:
- Does the device route correctly between VLANs?
- How fast can the switch route between VLANs?
- What is the throughput of the switch when handling traffic at Layer 3?
- What is the longest packet burst that the device can handle?
The above tests rely on measuring traffic on a per-port or per-device basis. There is, however, increasingly a requirement to provide measurement on a per-flow basis, for example, to support QoS testing.

In QoS testing, each port may receive packets from different traffic flows. Either through signaling or policy configuration, the flows may receive different treatment. To fully test its behavior, the test methodology must involve measurements on a per-flow basis. This will allow us to answer questions such as:
- What percentage of the packets were delivered in-sequence for each flow?
- What is the latency of the packets of a particular flow?
- What is the latency variation of a particular flow?
- How does the configuration of the switch (number of queues, priority of the queues, bandwidth allocated to each queue) affect the above behavior?
Sample test scenarios
To illustrate the test methodology, the following testbed was setup:
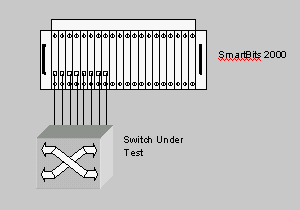
Each port was configured as a 100 Mbps Ethernet port. Three VLANs were setup as follows:
VLAN red
- Ports 1, 2, 5 and 6
- IP address 10.1.11.0/24
VLAN blue
- Ports 3 and 4
- IP address 10.1.12.0/24
VLAN green
- Ports 7 and 8
- IP address 10.1.13.0/24
The test instrument used was the SmartBits 2000 from Netcom Systems with ML-7710 cards. The software used was SmartFlow 1.0.
The switch under test was a multi-layer switch that supported the following features:
- Layer 2 switching with VLAN support
- Layer 3 switching (routing) with support for common routing protocols such as OSPF
- Support for IP multicasting
- Traffic prioritization based on physical port, IP address, and TCP port
The following tests were run and the results presented here in order to illustrate the concept of per-flow testing and how the results can be used to interpret the behavior of the device under test.
Test 1: Testing the switching capacity
In the first test, the ability of the switch to forward packets at wire-speed was tested. Eight flows were configured such that each port would transmit at varying speeds towards another port. The load was gradually increased from 10% up to 100% in increments of 10%. The following graph shows the test result:
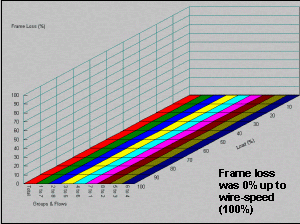
The graph shows that the frame loss was 0% for all loads. This test shows that the switch was able to forward packets at up to wire-speed for eight full-duplex ports. This test can be used to determine the switching capacity of the backplane in order to verify claims that "the switch is non-blocking for up to n number of full-duplex ports".
The traffic configured for this test was non-meshed (that is, traffic goes between port-pairs). For more comprehensive testing, tests can also be run with traffic that is partially meshed (one to many) or fully meshed (many-to-many).
Test 2: Determining the latency jitter
In the next test, we investigated the latency jitter under three different conditions. In the first run, all packets were transmitted from port 1 to port 3. The following graph shows the latency variations at 60% load:
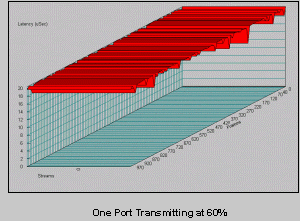
The test shows that the latency was between 18 and 20 microseconds with only minor variations. In the next run, packets were transmitted simultaneously from ports 1 and 2 to port 3. Each port was transmitting at 30% load. Thus the aggregate output traffic on port 3 remained the same at 60%.
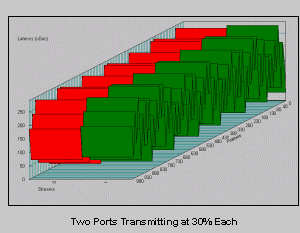
The graph shows that the addition of another stream had a dramatic effect on the latency variation. The latency fluctuated between 300 and 20 microseconds. In the next run, another flow was added. This time, each port was transmitting at 20% load. Thus the output load on port 3 remained at 60%.
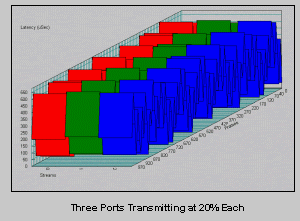
With three flows, the latency variation was even greater. Now the latency fluctuated between 20 and 600 microseconds. Note that this effect will be magnified when multiple switches are cascaded together. Thus a real network involving many switches will see latency fluctuations that will exceed the operational tolerance of real-time applications such as voice over IP.
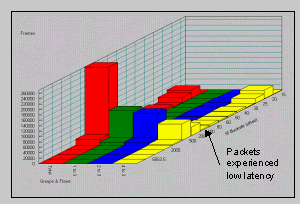
To further quantify the behavior of latency, the latency distribution was measured and graphed. Instead of taking snapshots of the latency variation of 1000 packets as in the case of the previous graphs, this graph shows the latency distribution of all packets during a 10-second test. It shows traffic from port 4 had more packets that experienced low latency when compared to the other ports.
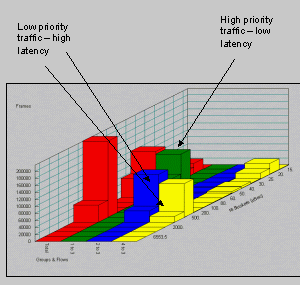
Many vendors offer priority queuing in their switches. With this feature, traffic can be assigned to different priority queues based on policy configuration. In the next run, traffic from port 1 was given high priority while the other two ports were given low priority.
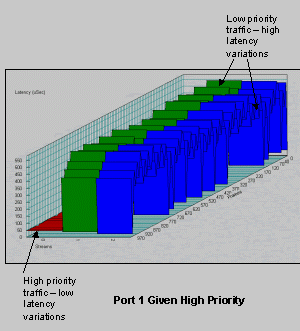
The effect of the configuration change was quite dramatic. Packets from port 1 experienced low latency variations (between 20 to 50 microseconds) whereas packets from the other ports experienced the same high latency variations.
The following graph shows the corresponding latency distribution:
Test 3: Prioritization based on port
In the next set of tests, the behavior of the switch under overload conditions was investigated. In the first run, three ports (ports 1, 2, and 4) transmitted traffic simultaneously at varying loads towards port 3. In this case, any load above 33% would result in an overload condition and the switch would be forced to discard packets. For example, when the load on each port was 100%, the switch would be forced to discard two-thirds of the traffic. The following graph shows the frame loss behavior:
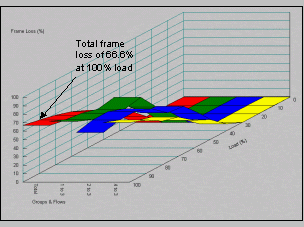
The graph shows that frame loss was 0% across all flows until the load exceeded 30%. At full-load, the total frame loss was 66.6% as expected. Frames were discarded across all flows. However, the switch appeared to slight favor port 4 at the expense of ports 1 and 2 (except at 100% load). The following graphs show the average latency.
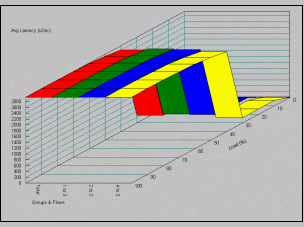
The graph shows that the average latency was fairly constant until the output port was overloaded. Then the average latency jumped to around 3000 microseconds. This behavior can be explained as follows. When there is sufficient bandwidth, the average latency simply reflects the statistical behavior of packet arrival. However, under overload conditions, many packets arrive to find the queue already full. The switch discards these packets. The lucky few arrive to find the queue almost full and manage to squeeze in. Thus the average latency reflects the delay as seen by these lucky packets and the time reflects the time it takes to wait in an almost full queue.
In the next test run, port 1 was assigned high priority. To prevent the high priority traffic from depriving the low-priority traffic of all bandwidth, a bandwidth cap of 80% was put on the high priority traffic. In other words, the high priority traffic was not allowed to exceed 80% of the bandwidth of any output port.
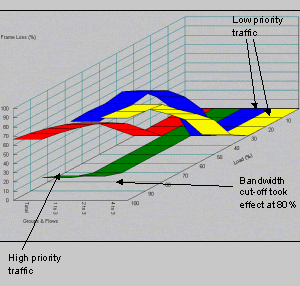
The graph shows that the total frame loss at 100% was still 66.6% since the total capacity did not change. However, traffic from port 1 did not experience frame loss until the bandwidth cut-off was reached at 80%. Interestingly, in this case, even though traffic from ports 2 and 4 was given low priority, port 4 seemed to be slightly favored at the expense of port 2 (same behavior was observed in the earlier test runs).
The impact on the average latency was equally dramatic:
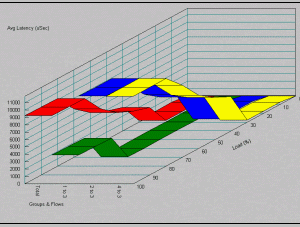
Here we see that the high priority traffic experienced much lower average latency than the low priority traffic. The tabular results (not shown here) show that the average latency of port 1 was around 50 microseconds until the load reached the bandwidth cutoff. At 100% load, port 1 was experiencing an average latency of around 4,000 microseconds while the remaining two ports had latency of around 12,000 microseconds (12 milliseconds).
Test 4: Prioritization based on IP address
In the next test, 9 IP flows were constructed. Each of the three ports (ports 1, 2 and 4) transmitted traffic towards port 3 using 3 different IP addresses. In this test, the IP destination of 10.1.12.1 was given high priority over the rest. Thus, one flow out of each of the three transmitting ports was given high priority:
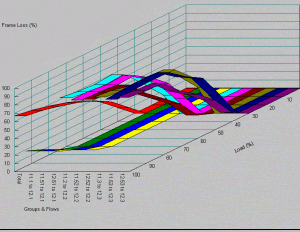
The graph illustrates that prioritization affected the three flows destined to 10.1.12.1 from the three ports. Just as in the previous tests, the distribution of the remaining bandwidth among the low-priority flows appeared somewhat uneven at times.
This technique of prioritization can be used, for example, to assign a higher priority to traffic to and from an application server.
Test 5: Prioritization based on TCP port
In this test, the effect of prioritization on TCP port was investigated. Twelve flows were configured. Each of the three transmitting ports was configured with four flows. Each flow was configured with a separate TCP port number simulating FTP, TELNET, POP, and HTTP traffic.
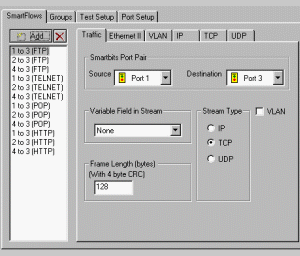
In this test, priority was given to TELNET (port 23) and POP (port 110). The following graph shows the results.
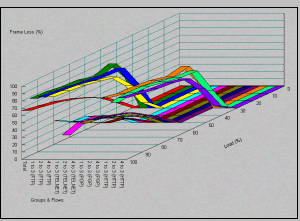
In this case, the bandwidth cut-off took effect earlier. With a 60% load on each port, the high priority traffic (which accounted for two out of the four flows on each port) amounted to 90% (0.5 x 60% x 3 ports) that exceeded the cut-off of 80%. Frame-loss for the remaining flows was much higher as a result.
About the author:
Angus Ma began his career as a software designer for Nortel Networks (formerly Bell-Northern Research). After leaving Nortel, he developed data communications products as well as UNIX based office systems. In 1986, Ma launched AHM Technology Corporation, which provides network design, analysis and troubleshooting services to large corporate clients. Ma has worked in data and telecommunications since 1980 and has extensive experience in planning, implementing, maintaining and analyzing enterprise networks. He can be reached at AHM Technology Corp., Network Design, Analysis and Training, 21 Saddlebrook St., Nepean, ON, Canada K2G 5N7. Tel: 613-723-7123; Fax: 613-723-2323; www.ahmtech.com.
